Rendering a mandelbrot set
I won`t start explaining what it is because other countless articles and papers have already covered everything infinitely better than I can and you`ve probably come here with background knowledge anyway. So, I`ll get straight into the topic.
z(n) = z(n-1)^2 + c, right ? Well it doesn`t make a lot of sense
to me: What is "n" and what is "c" ?, where do I get them from ?, how do I glue THIS to an actual image ?
Let`s start from the start: understanding the role of this formula in our goal.
Understanding the formula
This z(n) is just a number, just like z(n-1) or c, they are
of a complex type.
(n) and (n-1) mean amount of iterations.
Let`s illustrate it with an example where z and c are just regular numbers:
    "z(0)" is a starting value of "z(n)" and "c" is a constant that will not change

    z(0) = 1
    c = 2

    so

    z(1) = z(1-1)^2 + c

    and that would be

    z(1) = 1 + 2
    z(1) = 3

    and

    z(2) = z(2-1)^2 + c
    z(2) = 9 + 2
    z(2) = 11

    and so on...
We take this formula and keep iterating until z(n)
reaches infinity (or is close to it OR is bigger than a certain threshold), then n would be a number of iterations
that were needed to decide that z really went|will go to infinity. If it doesn`t go to infinity - then c belongs
to the set.
The threshold to compare z with is 2. If z is bigger -> it will escape
to infinity and we should break out of a loop and return the number of iterations n.
So, the role this formula plays in plotting a mandelbrot set is that it provides us with a number of iterations to
color a pixel on the image plane and if this number of iterations is very big - then this point most probably belongs to the set
and should be distinctively colored.
Again, n == future color of a pixel.
Example function in Rust:
/// Returns amount of iterations that were necessary to decide that z escapes to infinity.
/// Returns None if z doesn`t escape to infinity even after specified number of iterations
fn mandelbrot_at_point(c: Complex, max_iterations: u32) -> Option {
    let mut z: Complex = num::Complex::new(0.0, 0.0);
        for n in 0..iterations {
            // a little improvisation. z should be compared with 2 instead, but there is
            // no support for that in the num crate
            if z.norm_sqr() > 4.0 {
                return Some(n);
            }
            z = z * z + c;
        }

    return None;
}
Plotting
So, where is the plotting part ? Well, see complex c as an argument ? - it
can and will be constructed from "real" pixel coordinates where x is treated as a real part of the
c and y is treated as an imaginary part.
Consider this naive approach:
/// Converts a pixel in an image plane to the point in the imaginary plane fn pixel_to_set_point(x: u32, y: u32) -> num::Complex{ return num::Complex::new( x as f64, y as f64, ) }
The return value of this function is our future c that we will pass to the mandelbrot_at_point function the
return value of which we will use to color the pixel.
Consider this chunk of code:
...

// set some maximum amount of iterations
let max_iter: u32 = 1000;

// loop over every image point
for y in 0..height {
    for x in 0..width {
        // get "c" from the current point
        let c = pixel_to_set_point(x, y);

        // call mandelbrot function and color the pixel according to the amount of iterations
        let pixel_color: u8;
        if let Some(iterations) = mandelbrot_at_point(c, max_iter) {
            pixel_color = (255.0 / iterations as f64) as u8;
        } else {
            // z didn`t escape to infinity, this one is probably whithin the mandelbrot set.
            // color it white.
            pixel_color = 255;
        }

        // let it be gray
        let pixel_rgb_color = Rgb([pixel_color, pixel_color, pixel_color]);
        ...
    }
}

...
This yields us such results:

There are some black pixels in the upper left corner, believe me. That won`t do, obviously.
Here comes a problem: the size of a mandelbrot set whithin its complex plane is very small compared to an actual image (it fits entirely in -2.5,-2.0x1.5,2.0 (upper left x lower right) on a complex plane). What to do then ? - Scale things !
We can use image dimensions as scaling factors:
/// Converts a pixel in an image plane to the point in the imaginary plane fn pixel_to_set_point(x: u32, y: u32, width: u32, height: u32) -> num::Complex{ return num::Complex::new( (x as f64 / width as f64), (y as f64 / height as f64), ) }
Aa~aand the output is:
That`s something ! As you can see, it does not fit that well. Remember about the mandelbrot`s own dimensions ? - Well, let`s use them (top-left is (real_start, imaginary_start), bottom-right is (real_end, imaginary_end)):
    /// Converts a pixel in an image plane to the point in the imaginary plane.
    /// where r_s is real start; r_e is real end; i_s is imaginary start and i_e is imaginary end
    fn pixel_to_set_point(x: u32, y: u32, width: u32, height: u32, r_s: f64, r_e: f64, i_s: f64, i_e: f64) -> num::Complex {
        return num::Complex::new(
            r_s + (x as f64 / width as f64) * (r_e - r_s),
            i_s + (y as f64 / height as f64) * (i_e - i_s),
        )
    }
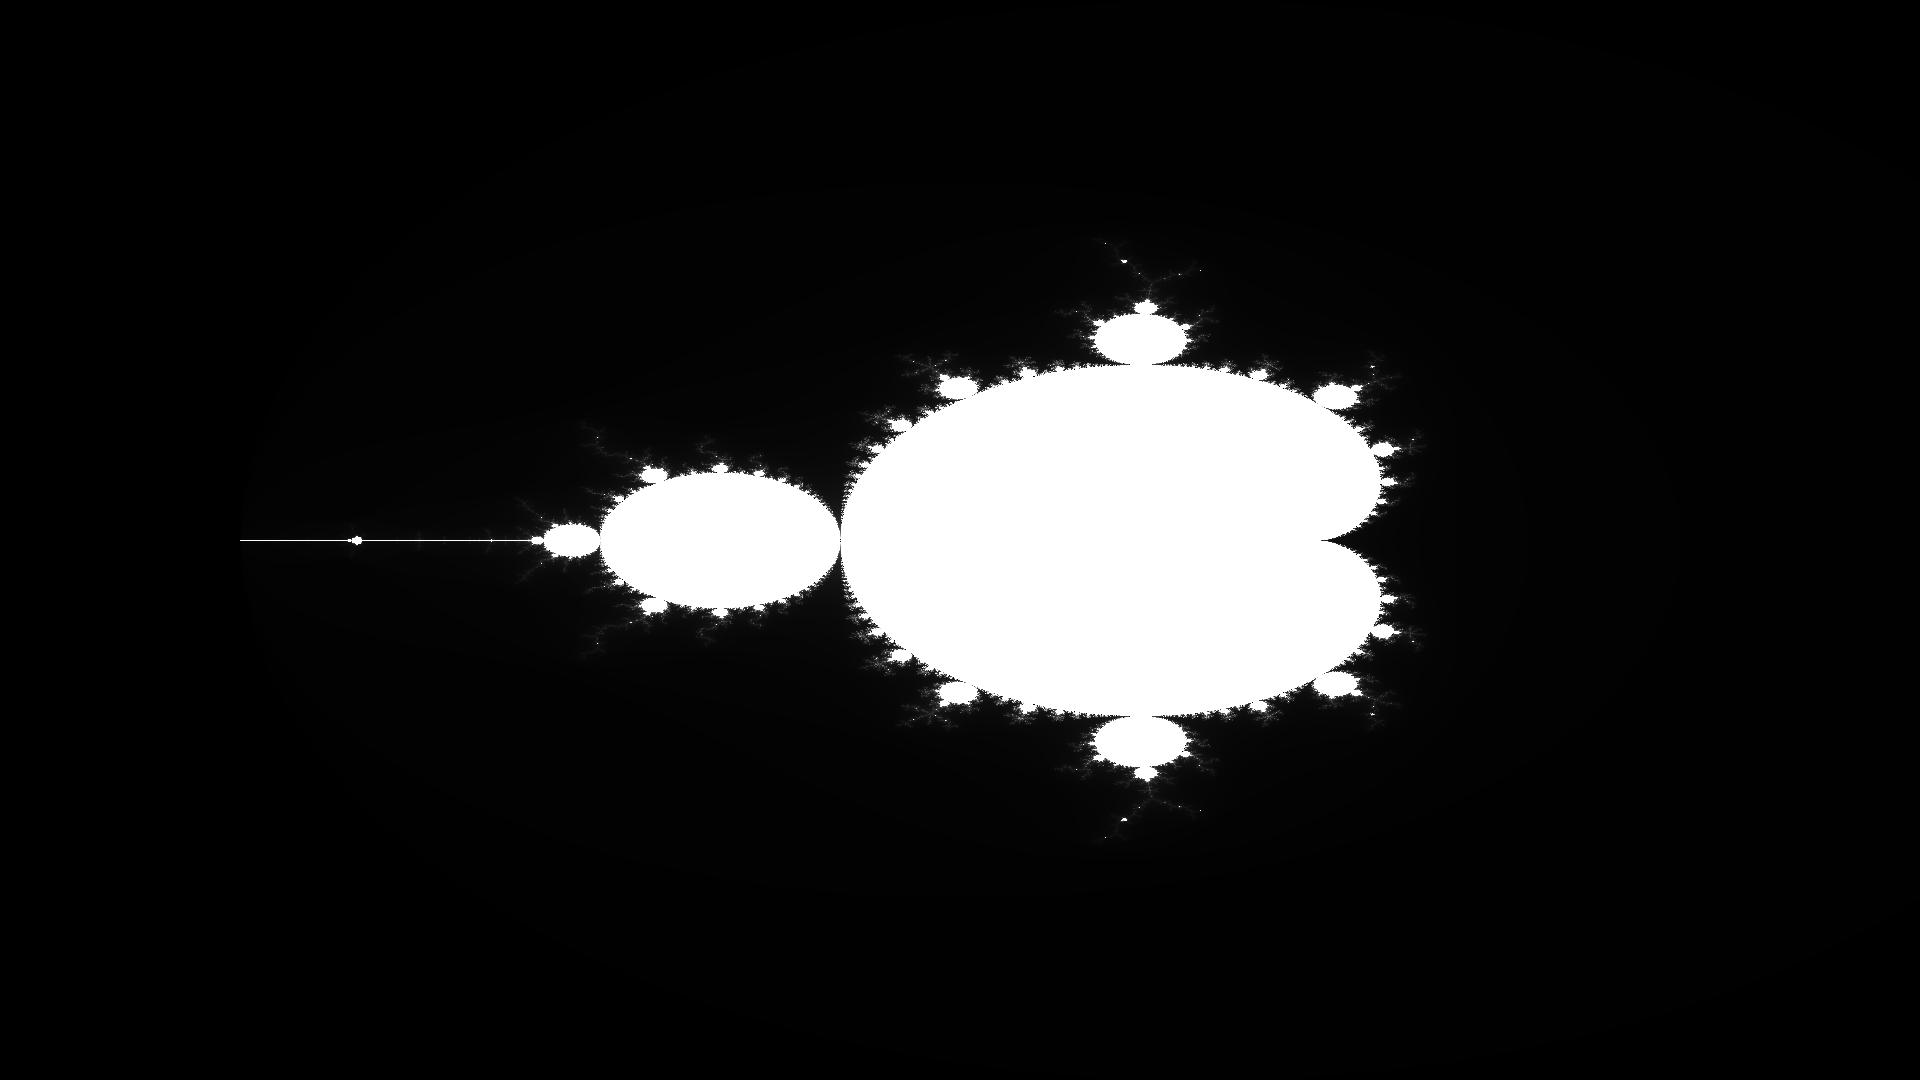
Now, the result is:
Right what we needed !
The objective is completed, but we can improve the coloring part a bit, more precisely - somehow remove this veil around the set.
I`ve come up with it just by playing around, but the results are unexpectedly good:
...

let re_start: f64 = -2.5;
let re_end: f64 = 1.5;
let im_start: f64 = -2.0;
let im_end: f64 = 2.0;

let width: u32 = 7680;
let height: u32 = 4320;

// set some maximum amount of iterations
let max_iter: u32 = 1000;

// loop over every image point
for y in 0..height {
    for x in 0..width {
        // get "c" from the current point
        let c = pixel_to_set_point(x, y, width, height, re_start, re_end, im_start, im_end);

        // call mandelbrot function and color the pixel according to the amount of iterations
        let pixel_color: u8;
        if let Some(iterations) = mandelbrot_at_point(c, max_iter) {
            // some god knows how working coloring algorithm
            pixel_color = ((iterations as f64 / 255.0).sin() * 255.0) as u8;
        } else {
            // z didn`t escape to infinity, this one is probably whithin the mandelbrot set.
            // color it white.
            pixel_color = 255;
        }

        // let it be gray
        let pixel_rgb_color = Rgb([pixel_color, pixel_color, pixel_color]);
        ...
    }
}

...
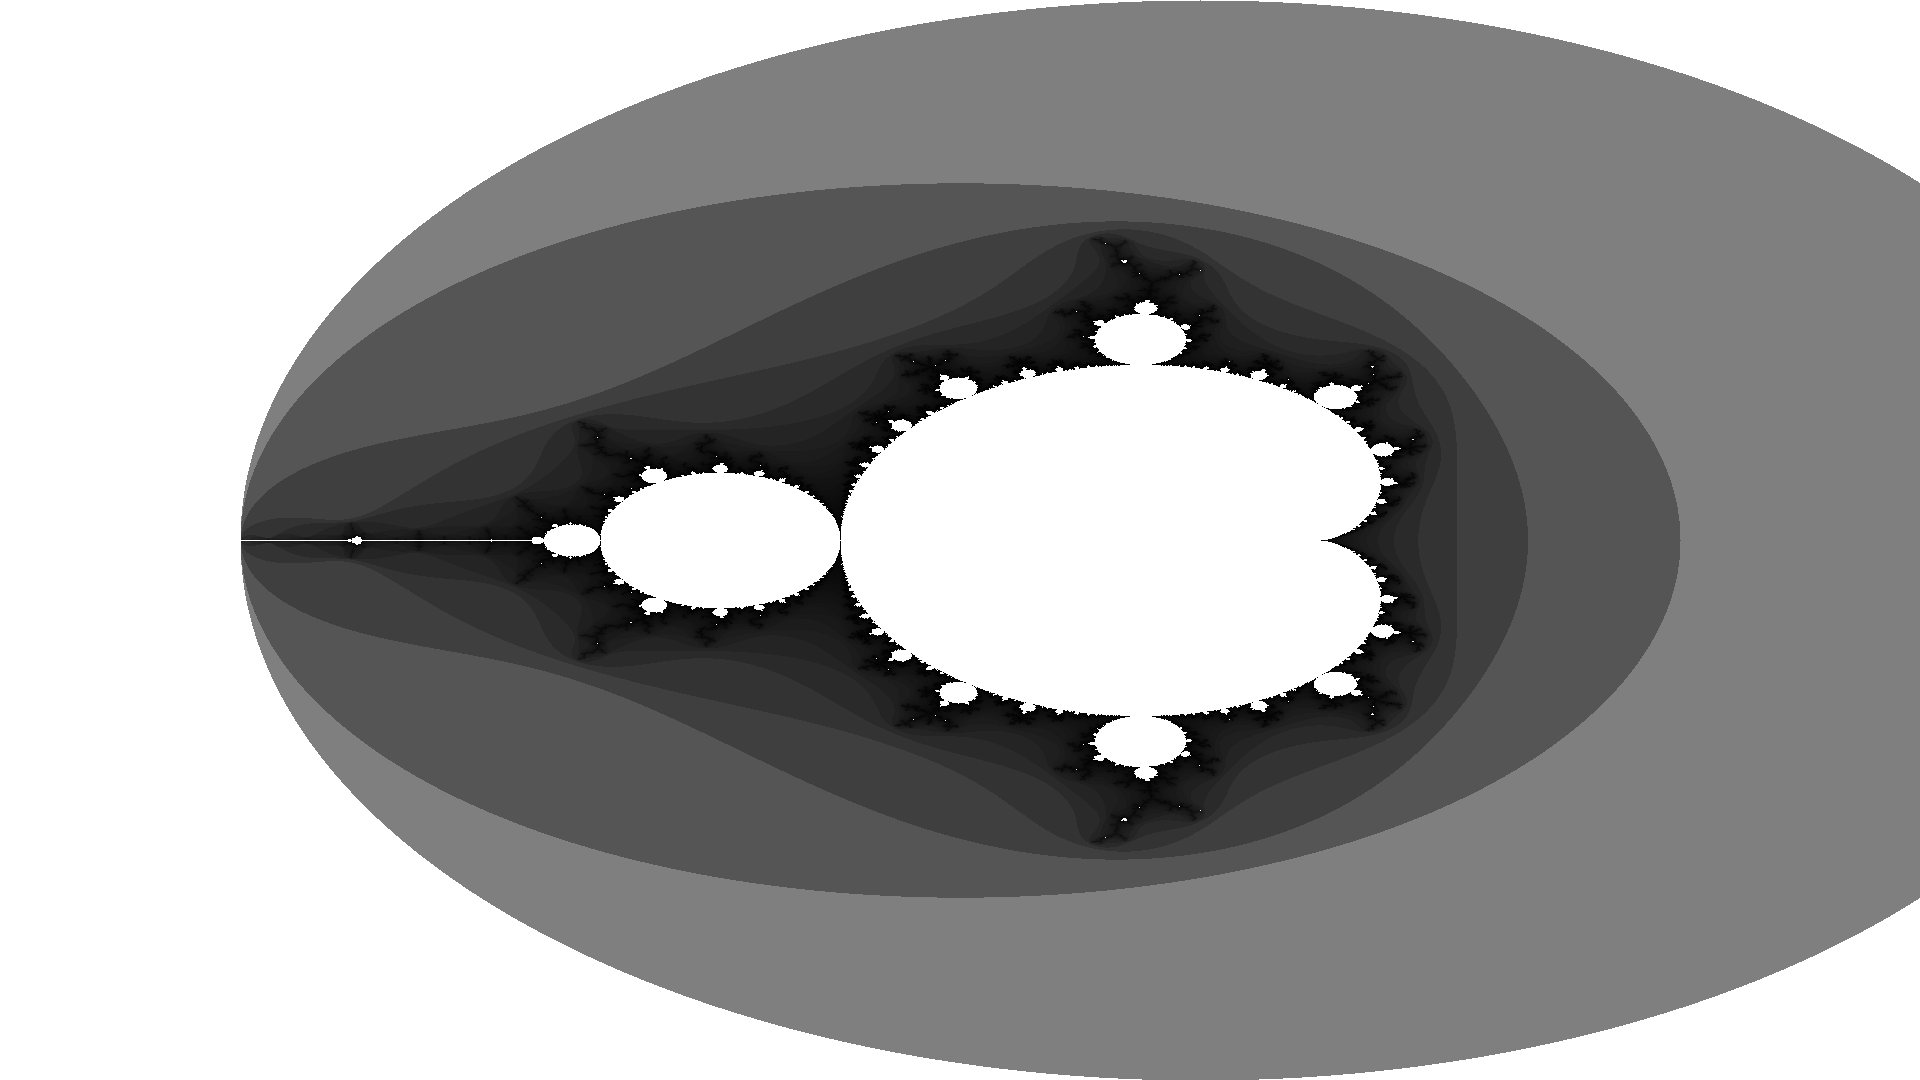
This algorithm gives us:
Zooming in
Now, all is good, but the most interesting parts are hidden deep whithin the set. What would be cool is to have the ability to zoom in.
Apparently that`s a whole lot easier task: we just need to tweak real_start, real_end and imaginary_start, imaginary_end to our liking (remember that (real_start,imaginary_start) is a top-left and (real_end,imaginary_end) is bottom-right).
For that just change these defaults:
...

let re_start: f64 = -2.5;
let re_end: f64 = 1.5;
let im_start: f64 = -2.0;
let im_end: f64 = 2.0;

...
For something like these:
...

let re_start: f64 = -0.55;
let re_end: f64 = -0.5;
let im_start: f64 = -0.55;
let im_end: f64 = -0.48;

...
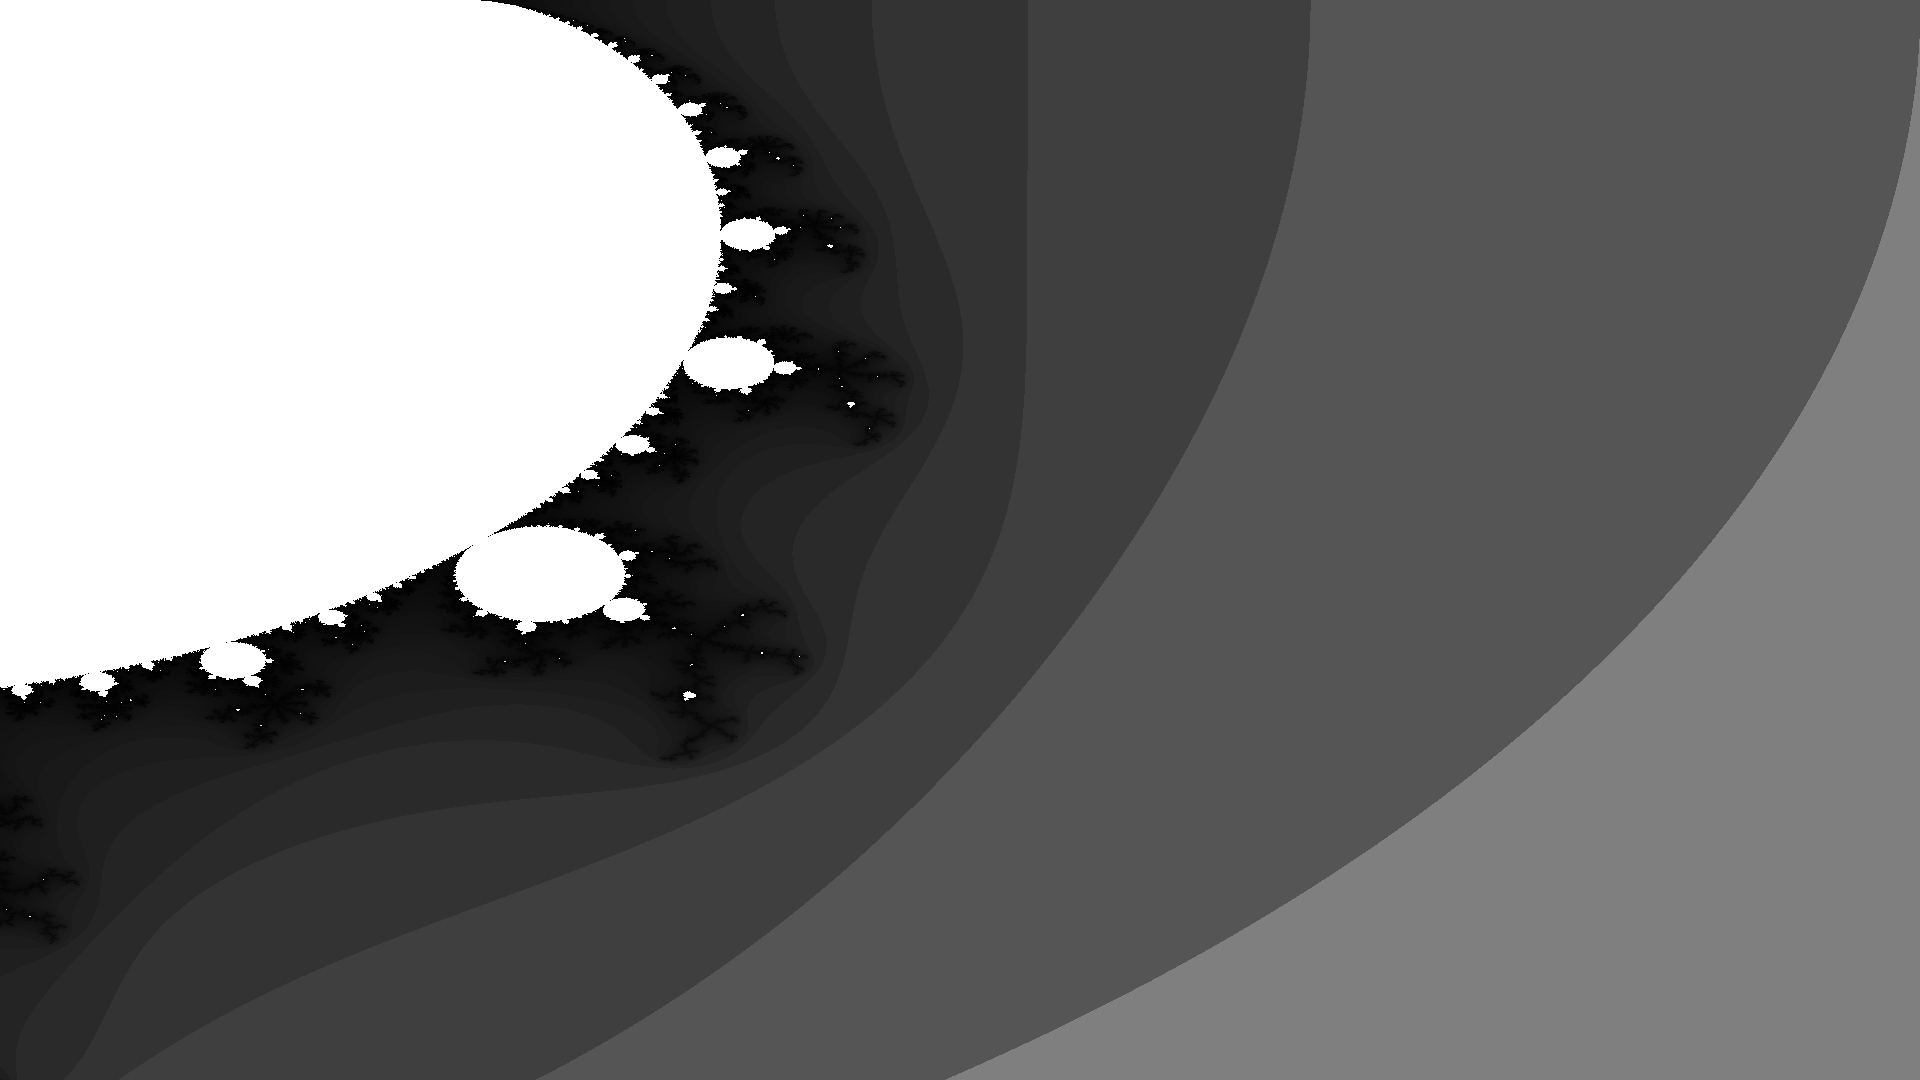
And you`ll get:
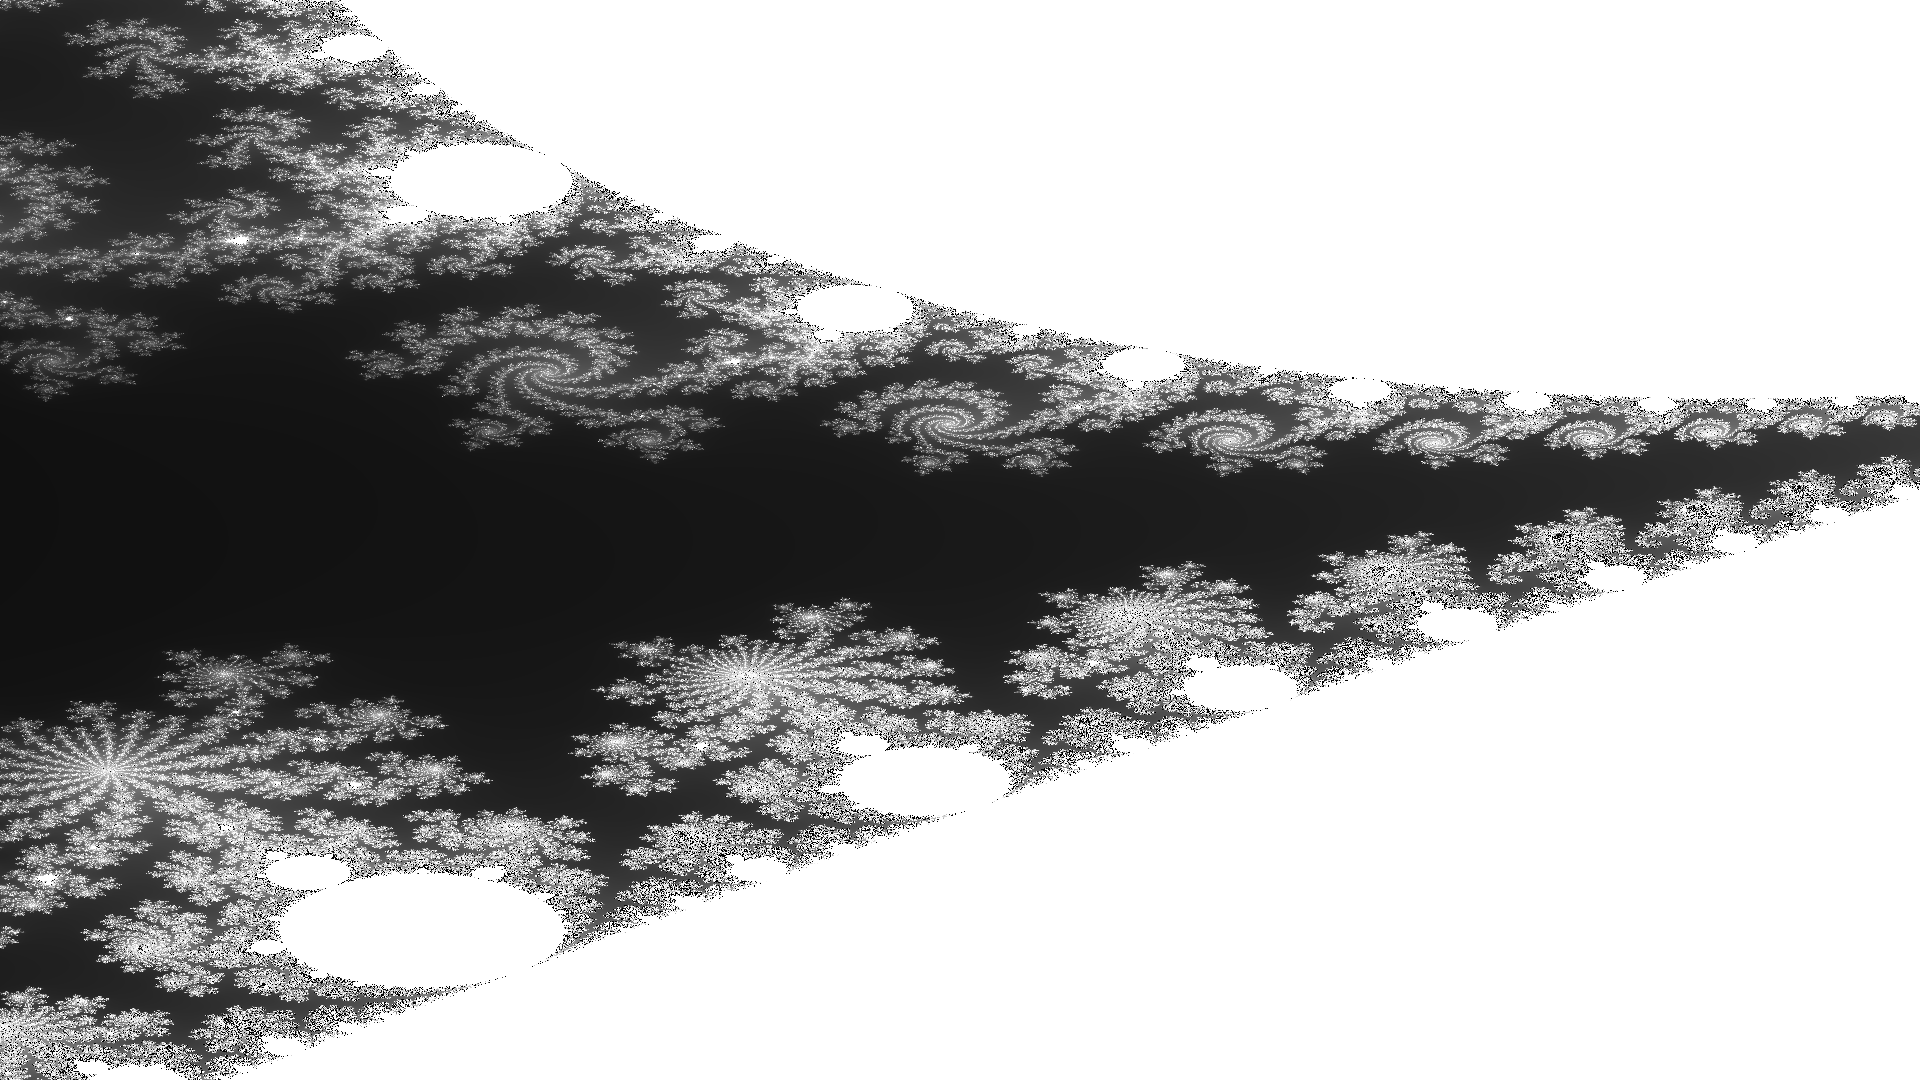
Cool !
Try to write a working program by yourself, tweak a coloring algorithm, add new features. You can look at my implementation below.
The whole working and additional code can be found:
[Categories:Math,Programming:] [Date:February 2022, May 2022:]